|
Home
Life Data Analysis
Maintenance Optimization
Engineered Software
Home Page
|
One million units were introduced into the field 6 months ago. The
number of failures per month are shown below.
| Month Ending |
Number of Failures |
| 1 |
20 |
| 2 |
28 |
| 3 |
17 |
| 4 |
35 |
| 5 |
12 |
| 6 |
22 |
What is the expected reliability of the population after 1 year in service?
Solution
This data is in interval format. Select "New" then
"Grouped Data" from the "File" menu. And enter the data as shown
below.
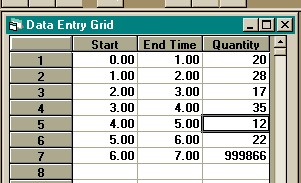
Row 7 of the grouped data input spreadsheet shown above does NOT
indicate that 999,866 units failed in the period from 6 months to 7 months. The last
row of the spreadsheet always contains the number of units that have not failed.
Select "Weibull" then "Probability Plot" from the
"Parameter Estimation" menu to obtain a probability plot estimation. Then
click the "Plot" button to obtain the plot. This is shown in the figure
below. When using grouped data, the only option for estimation is probability
plotting. Because of the large sample size with grouped data, probability plotting
is as accurate as maximum likelihood estimation. The large sample size also
eliminates the need for confidence intervals. The estimated values are nearly the
same as lower or upper confidence levels.
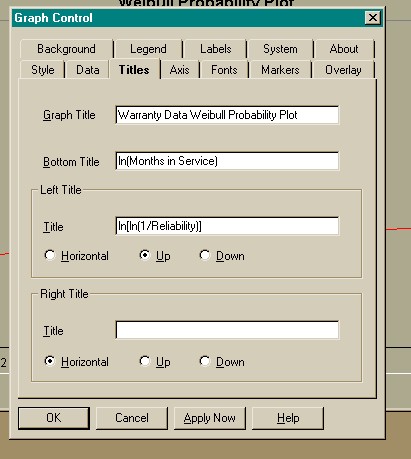
If the default graph is not in the format you want, right click on the
graph, and the dialog box shown below will allow you to customize the colors, title,
background, colors, etc.
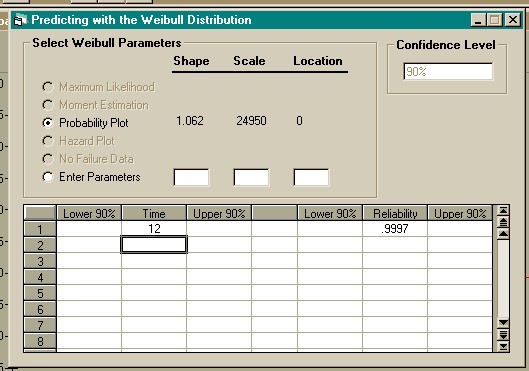
The points on the probability plot follow the straight line, so the
Weibull distribution is accepted as a model. Select "Weibull" from the
"Predictions" menu. Click the spreadsheet in the first row under the
"Time" column and enter 12. After entering 12 press the down cursor or
press the "Enter" key. The expected reliability at 1 year in service (12
months) is 0.9997. This is shown below.

|
